WebPrice is the web application that DE.MI Europe clients use to keep competitor prices under control. It lets you view surveys collected at rival supermarkets, track how prices change over time and keep an eye on ongoing promotions.
The Challenge
The previous system was built on a server-side rendering architecture with a fragmented UX that made quick data analysis cumbersome. The request was to start from scratch with a modern, reactive application designed for intensive daily use.
Goals
Replace the legacy system with a modern, fully responsive SPA
Deliver real-time dashboards and analytics across hundreds of survey campaigns
Handle data grids with 700+ rows and 80+ columns with filtering, sorting and optimised Excel export
Integrate promotional flyer viewing directly within the application
Implement secure authentication with JWT and rate limiting
Key Challenges
The most demanding technical points were: high-performance data grids (AG Grid with virtual scrolling), building a configurable index system supporting multiple formulas (Standard, Inverse, Coupled), and the real-time price delta calculation engine across multi-dimensional datasets (product × store × time period).
The Solution
I designed and developed the entire application: an Angular architecture with hierarchical routing, PrimeNG as the UI component library, AG Grid for data tables, Chart.js for charts and pdf.js for the flyer viewer. The backend is a minimal REST API in ASP.NET Core with JWT authentication.
Surveys — Prices
The core of the application. Each situation exposes three tabs:
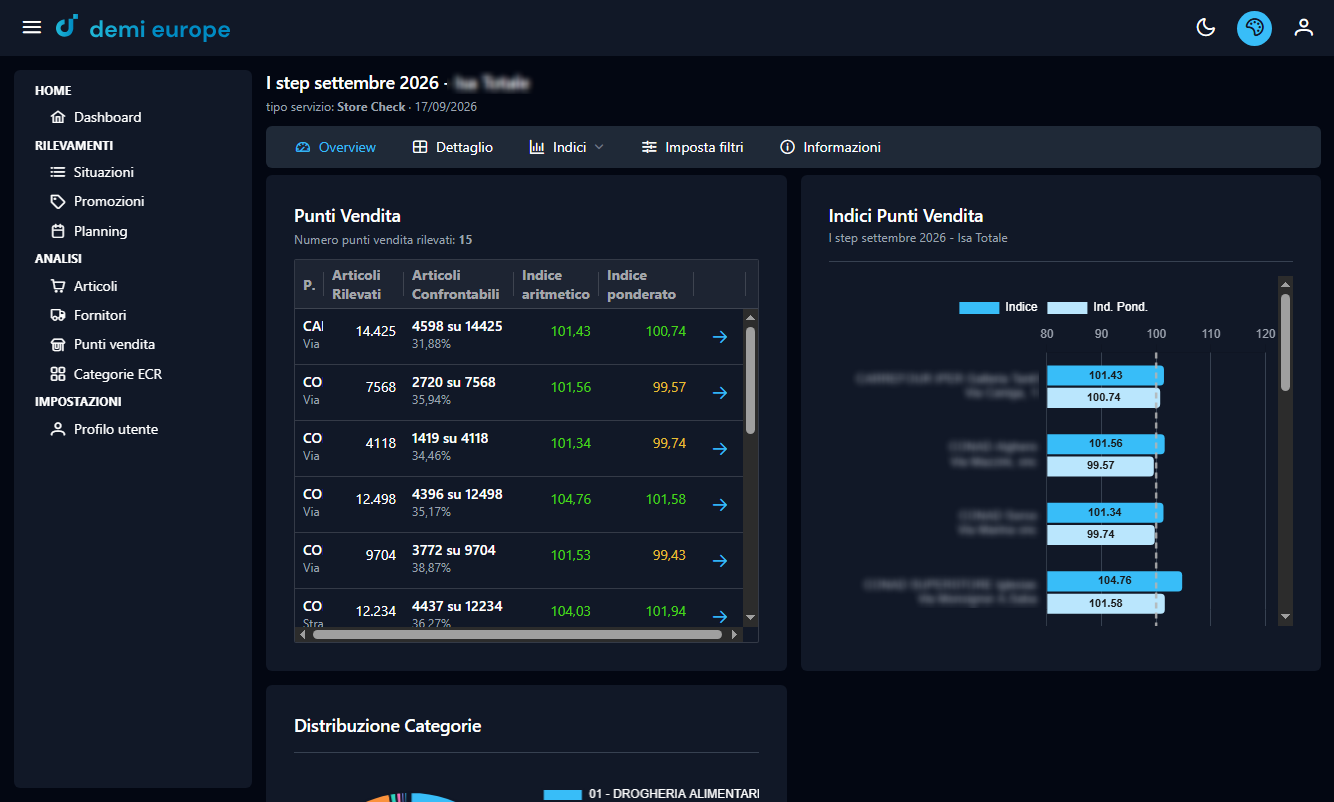
Overview: store table with surveyed items, arithmetic and weighted indices, alongside a comparative bar chart
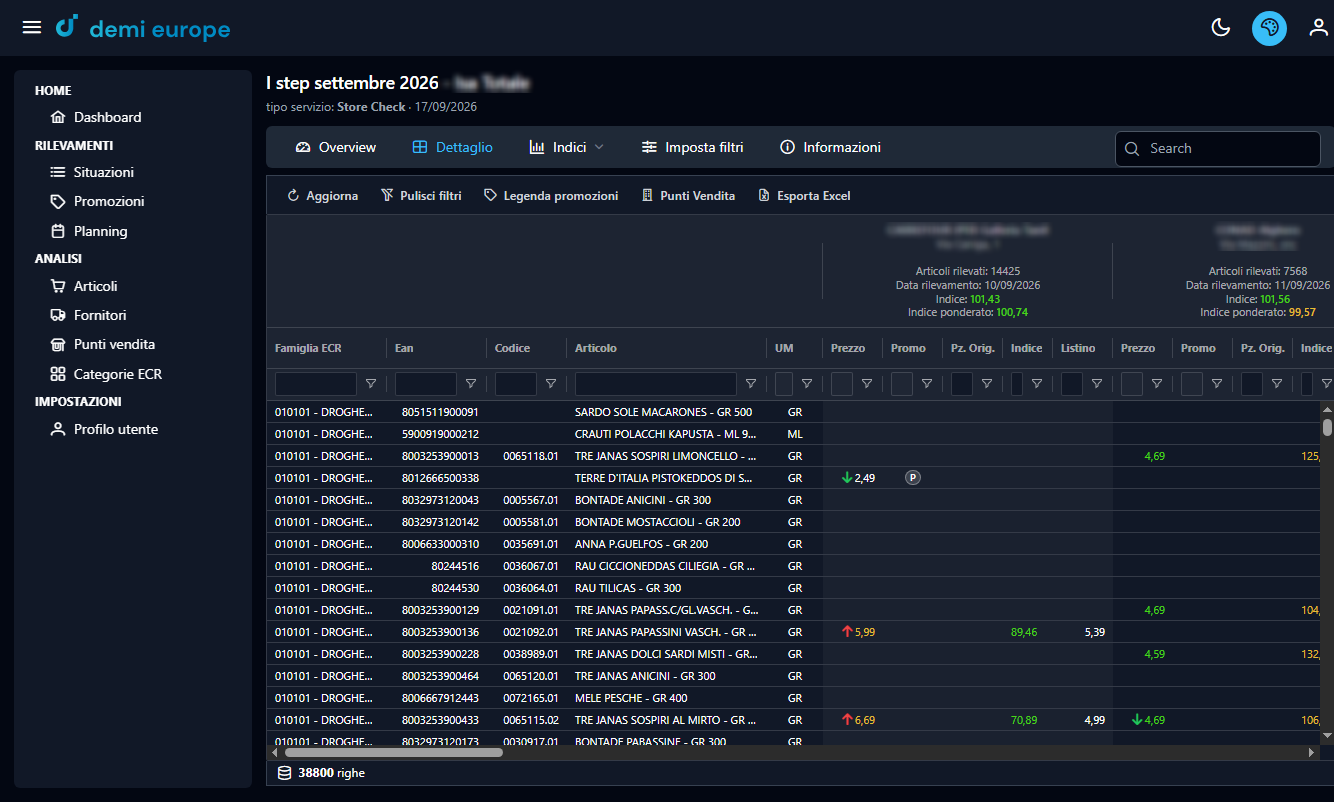
Detail:AG Grid with every product row and columns for each store — prices, promotions, original price and index per combination
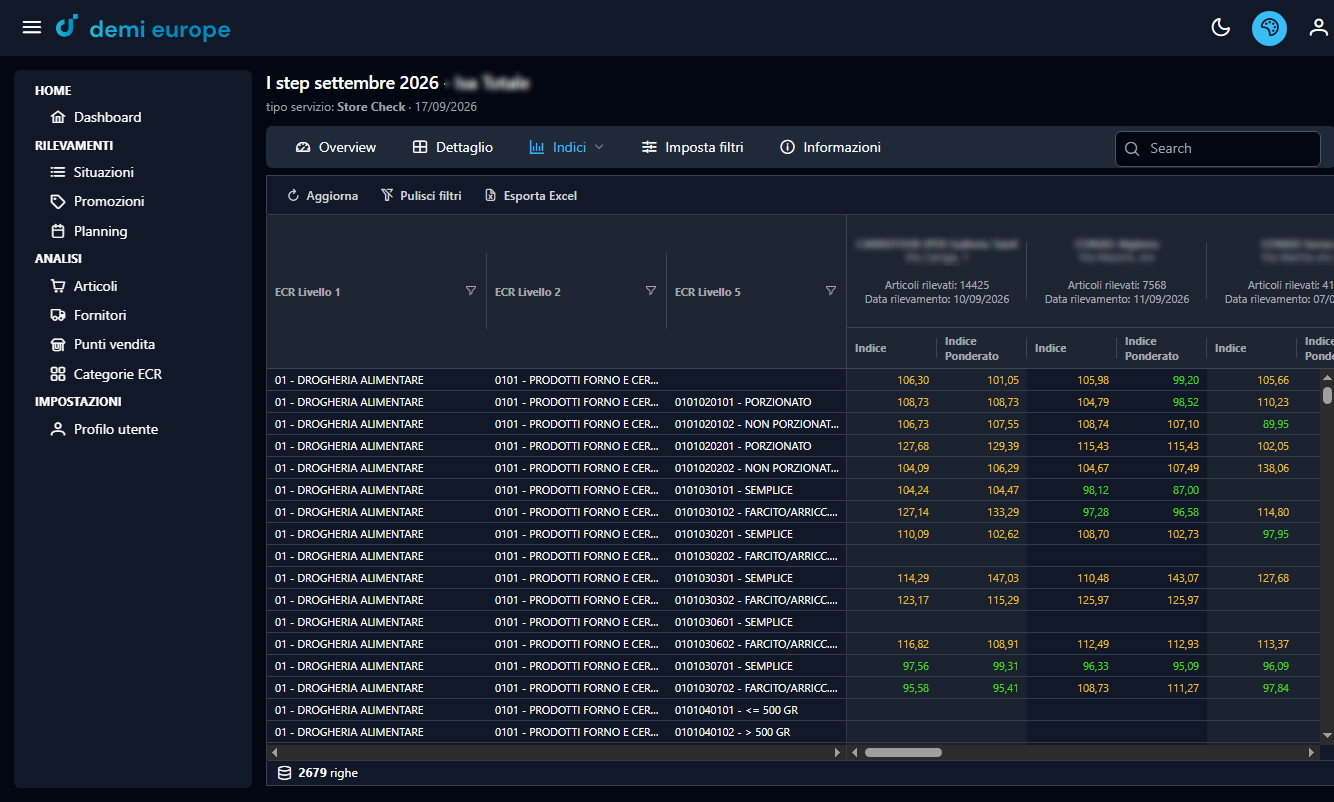
Indices by category: index breakdown across 3-level ECR categories, comparing all surveyed stores
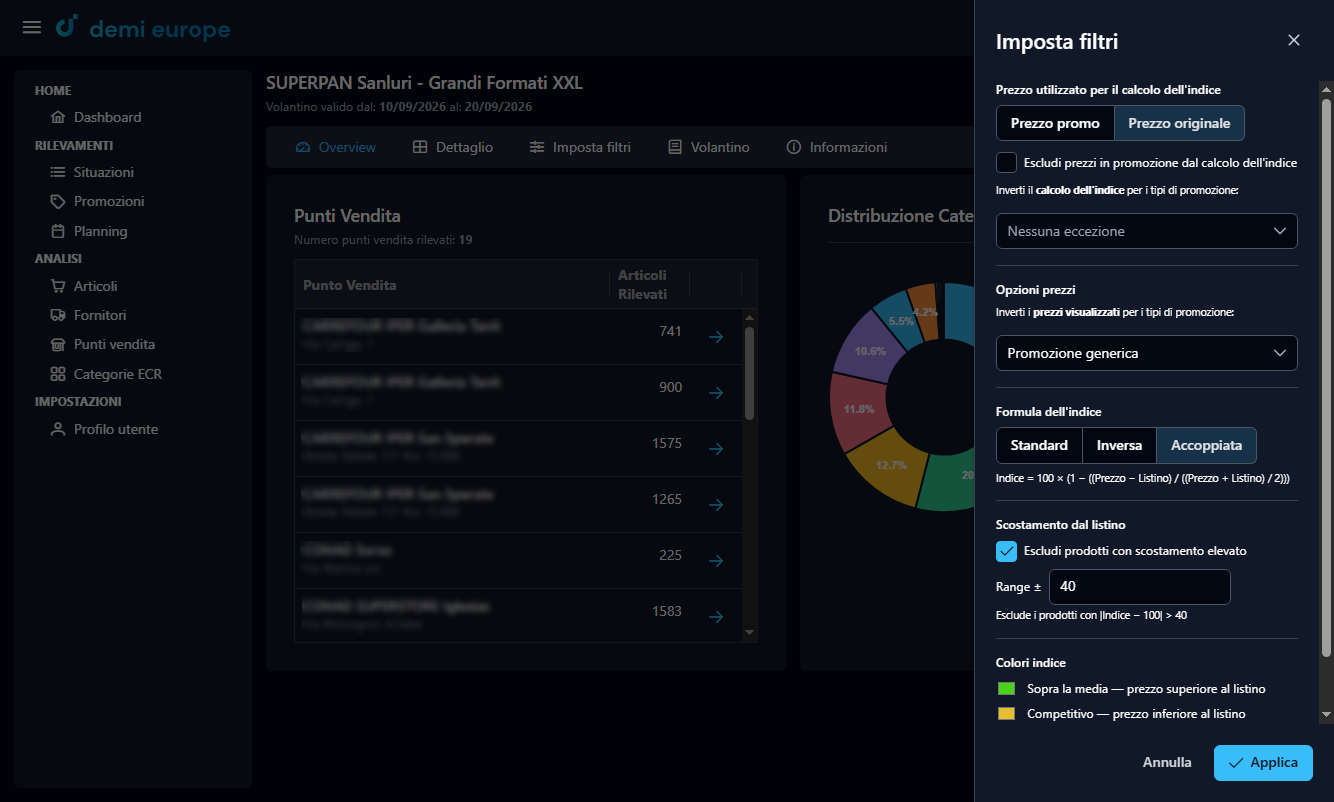
The Set filters panel lets users configure the index formula, the price used for calculation, promotional exceptions and the maximum accepted deviation.
https://rilevamenti.demieurope.com
Overview: indices per store + comparative bar chart
https://rilevamenti.demieurope.com
Detail: AG Grid showing prices per product and store
https://rilevamenti.demieurope.com
Category indices: 3-level ECR breakdown per store
Analytics — Store
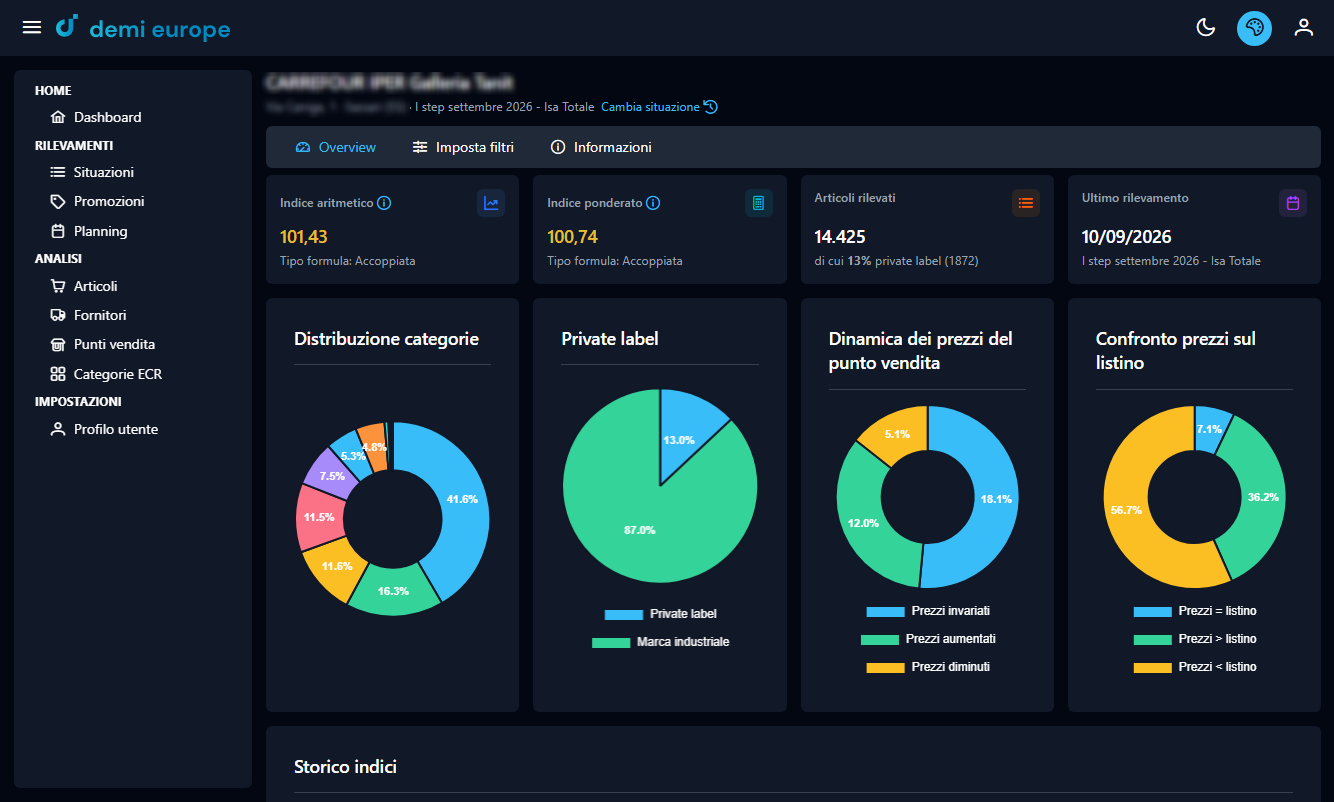
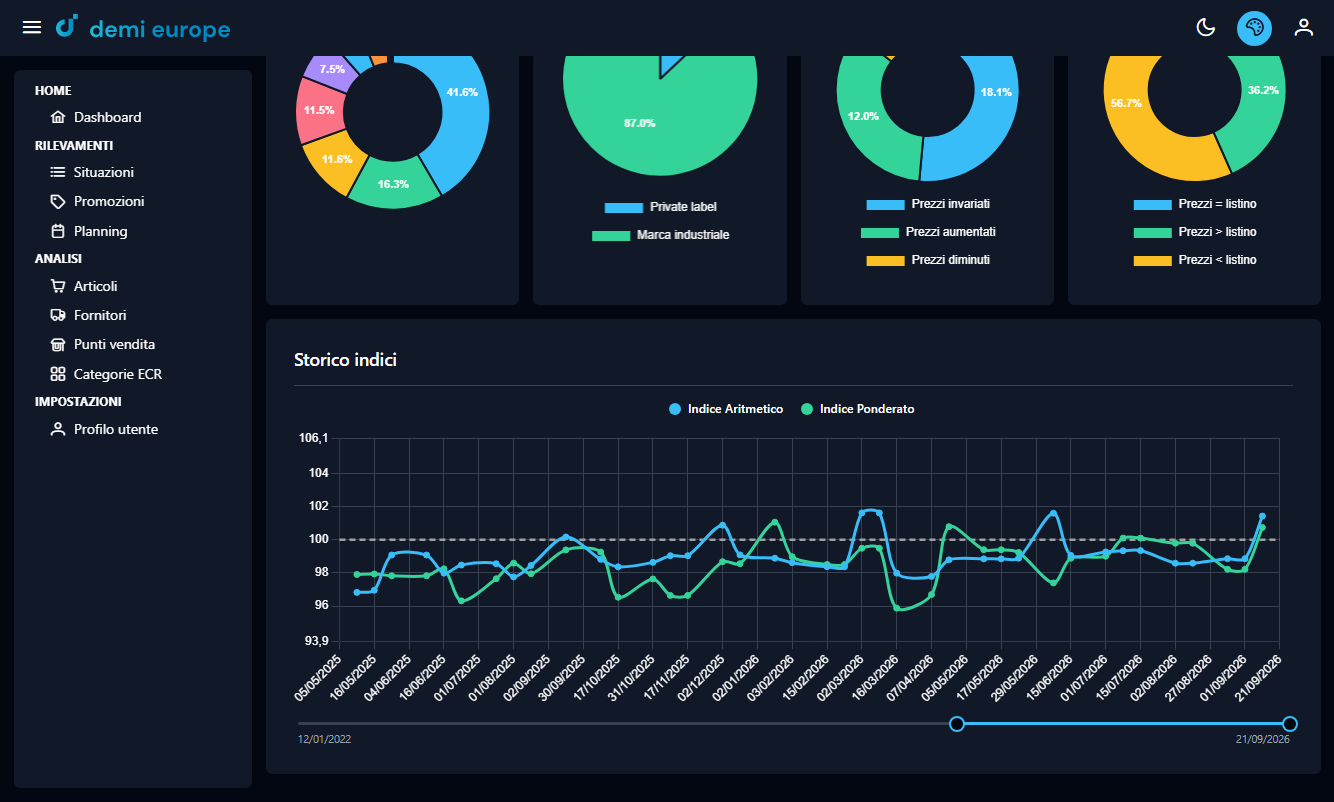
A dedicated dashboard for each surveyed store. It shows the arithmetic and weighted index, number of surveyed items, three donut charts (category distribution, price dynamics, comparison against price list) and a historical index chart with an interactive time slider. The filters panel lets you customise the formula and calculation parameters.
https://rilevamenti.demieurope.com
Overview: KPIs, category distribution and price dynamics
https://rilevamenti.demieurope.com
Donut charts: category mix, private label share and price moves against the list price
https://rilevamenti.demieurope.com
Filter panel: index formula, promotion handling and deviation
Analytics — Products
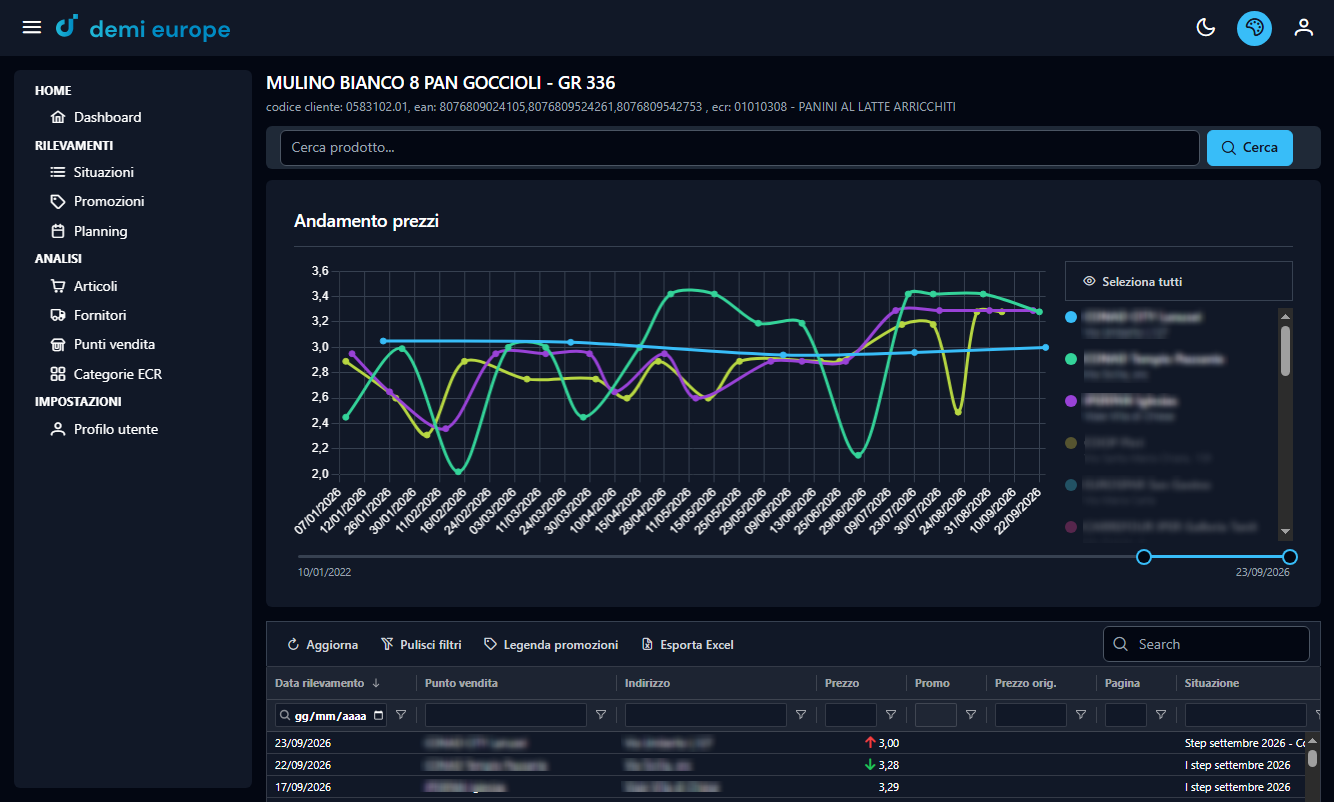
Each product has a historical price chart showing all surveyed stores, with an interactive legend to toggle individual series. The table below details every survey entry: date, store, price, any promotion and the reference campaign.
https://rilevamenti.demieurope.com
Multi-store price trend with interactive Chart.js graph
https://rilevamenti.demieurope.com
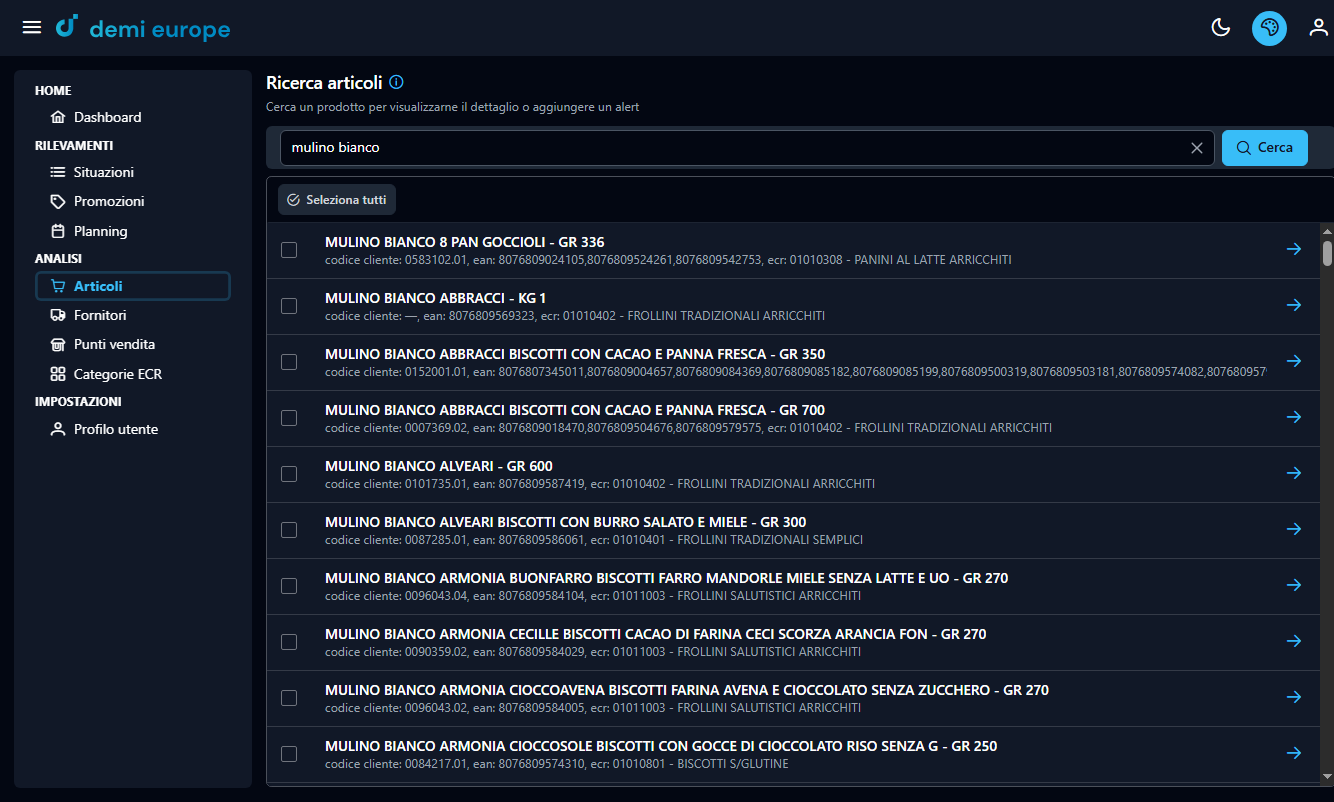
Full-text product search: opens the product detail or sets a price alert on it
Surveys — Promotions
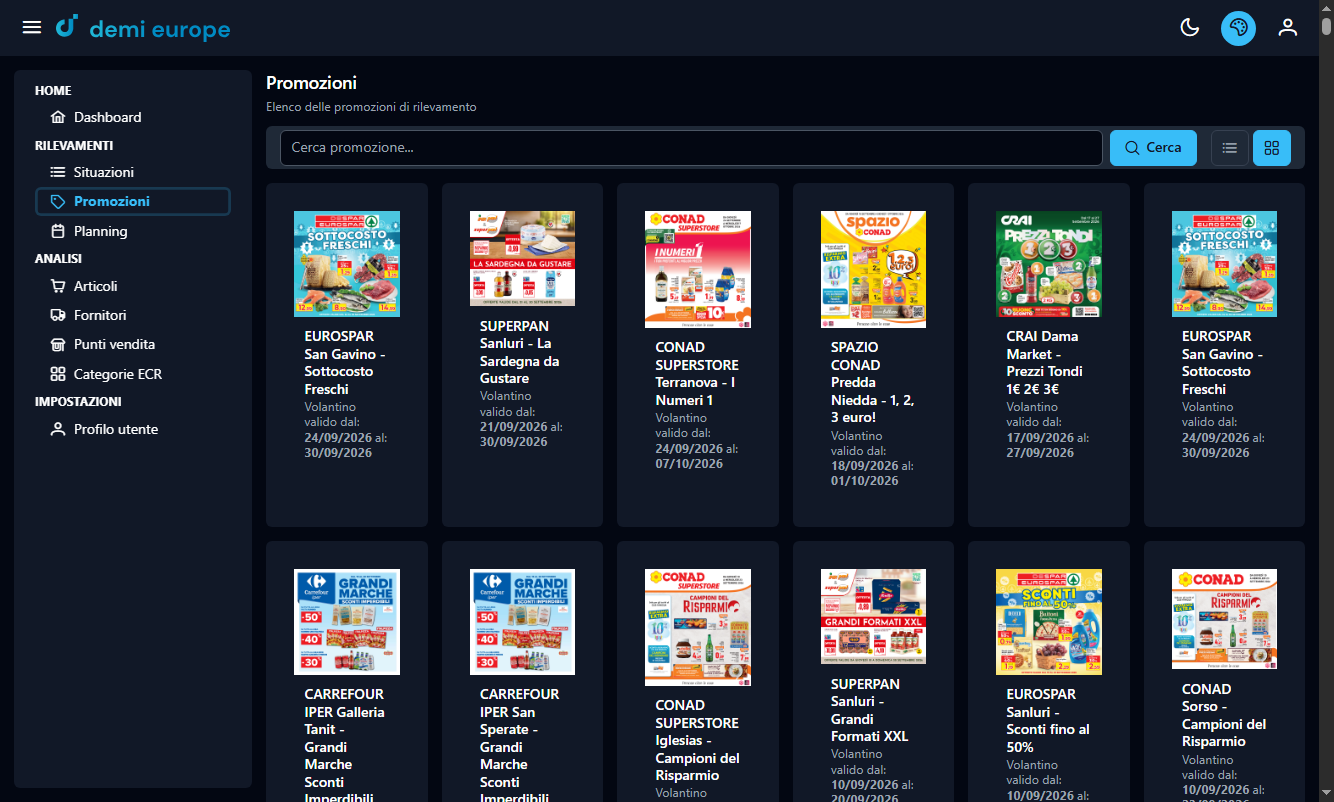
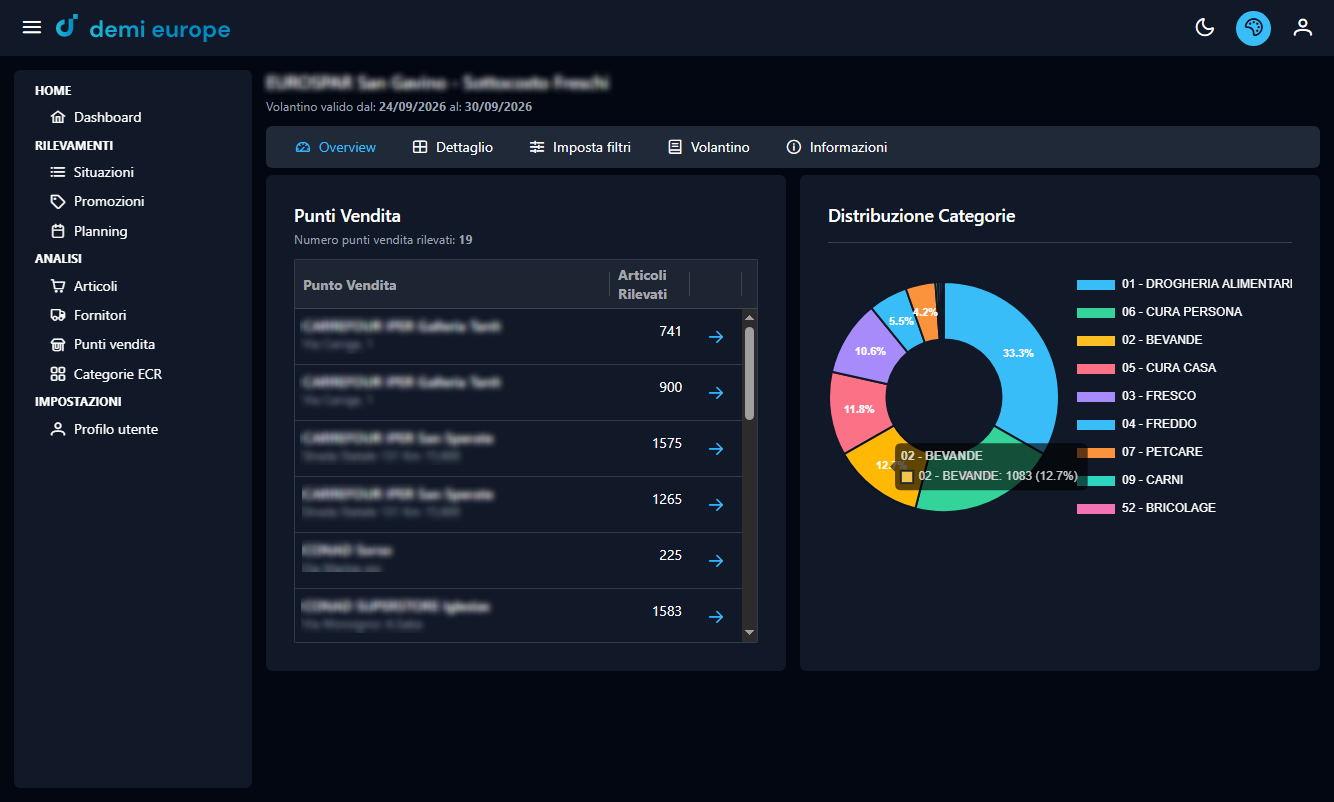
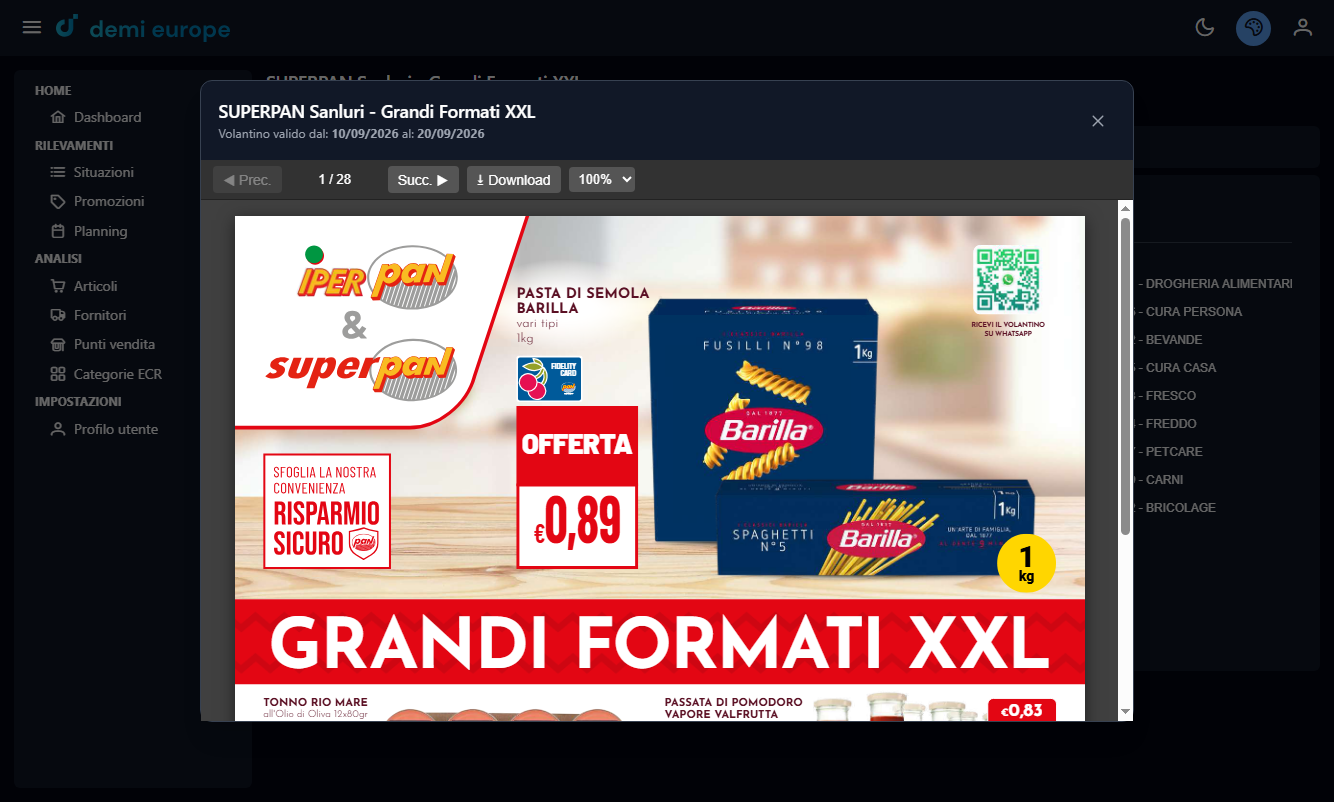
A dedicated section for surveyed promotional flyers. Each promotion has a flyer thumbnail, validity period and links to an overview with the list of covered stores and distribution of promoted categories. The integrated viewer (pdf.js) lets you browse the flyer page by page directly in the app.
https://rilevamenti.demieurope.com
Promotion list with flyer thumbnail and validity period
https://rilevamenti.demieurope.com
Promotion overview: covered stores and category distribution
https://rilevamenti.demieurope.com
Integrated PDF viewer (pdf.js) for browsing the flyer
Surveys — Planning
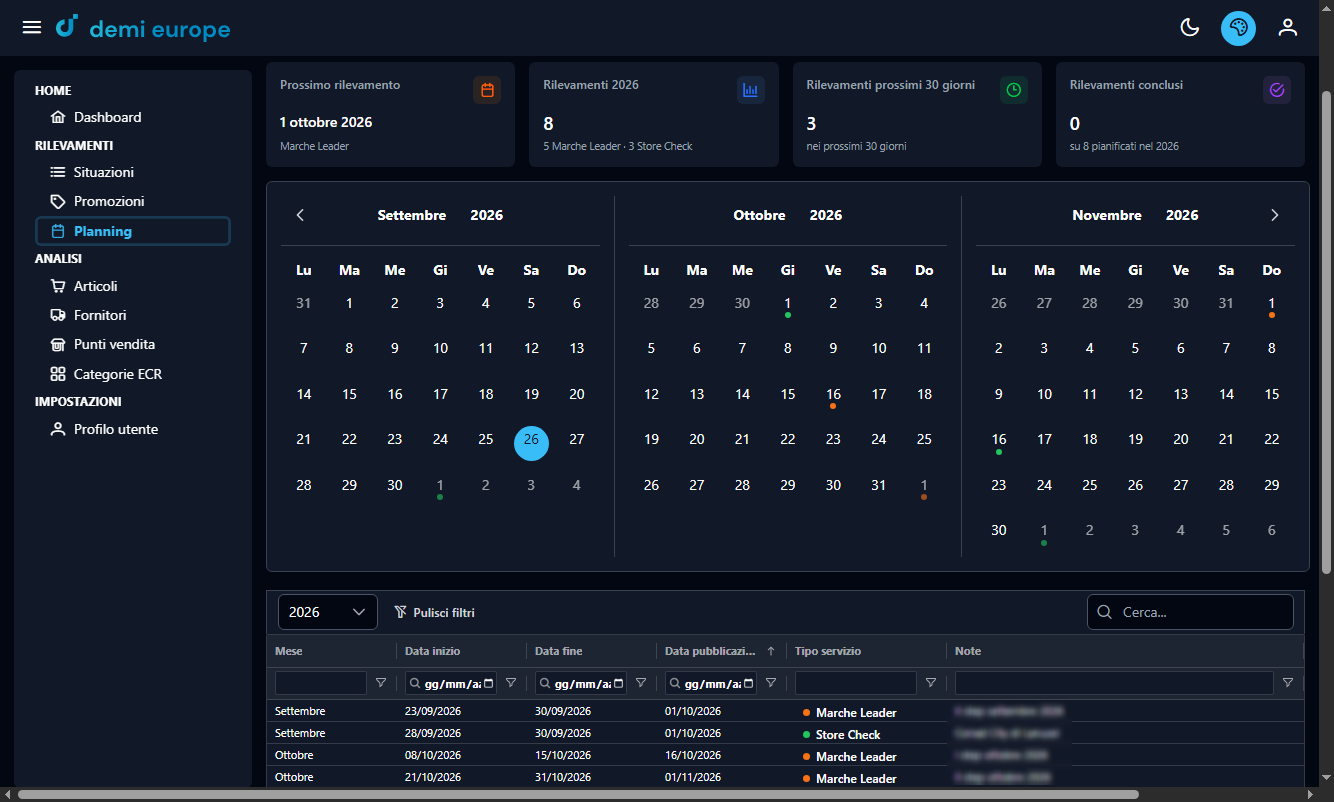
A 3-month calendar showing scheduled survey campaigns via colour coding. Key KPIs are displayed: next survey date, total annual surveys, upcoming surveys in the next 30 days and completed ones.
https://rilevamenti.demieurope.com
Analysis Tools
Two supporting sections complete the system:
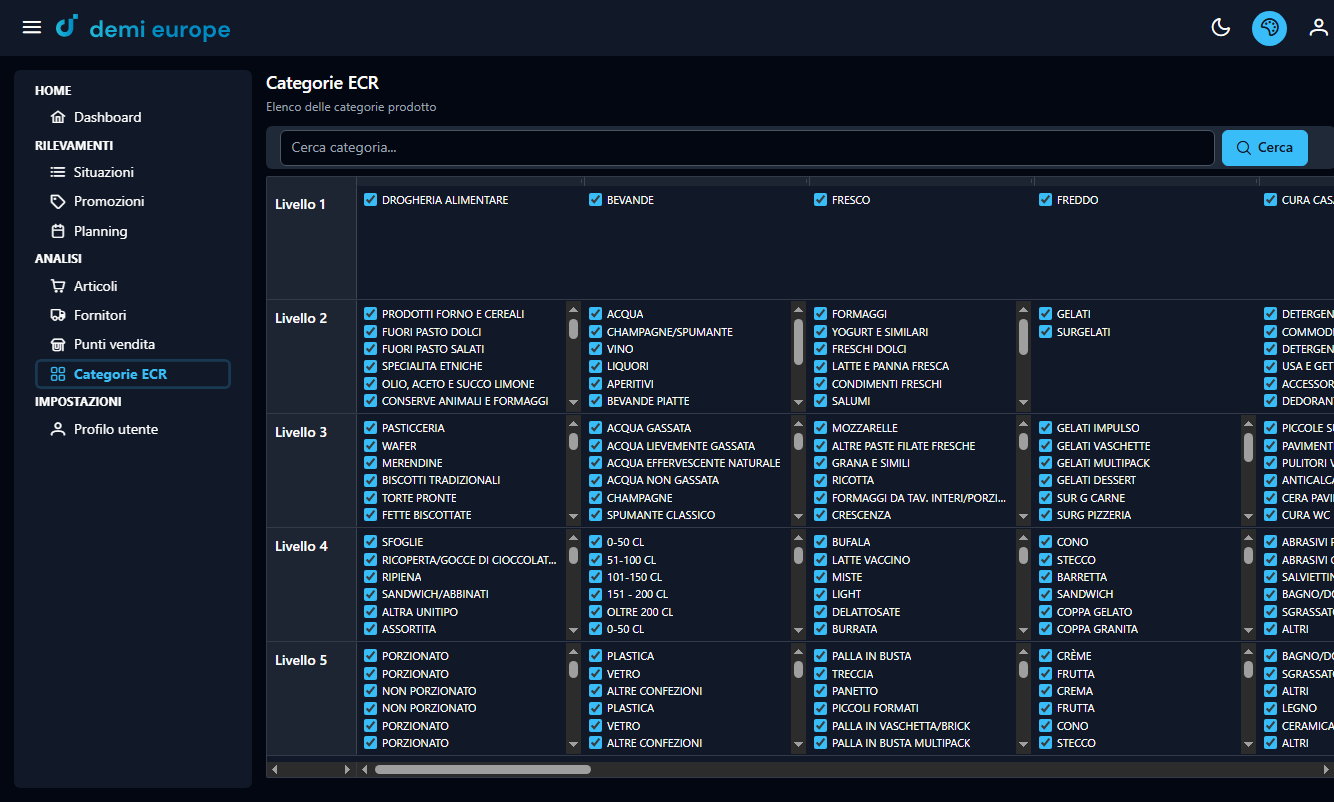
ECR Categories: a 5-level product category hierarchy (ECR standard) with search and the ability to enable/disable categories to refine analysis
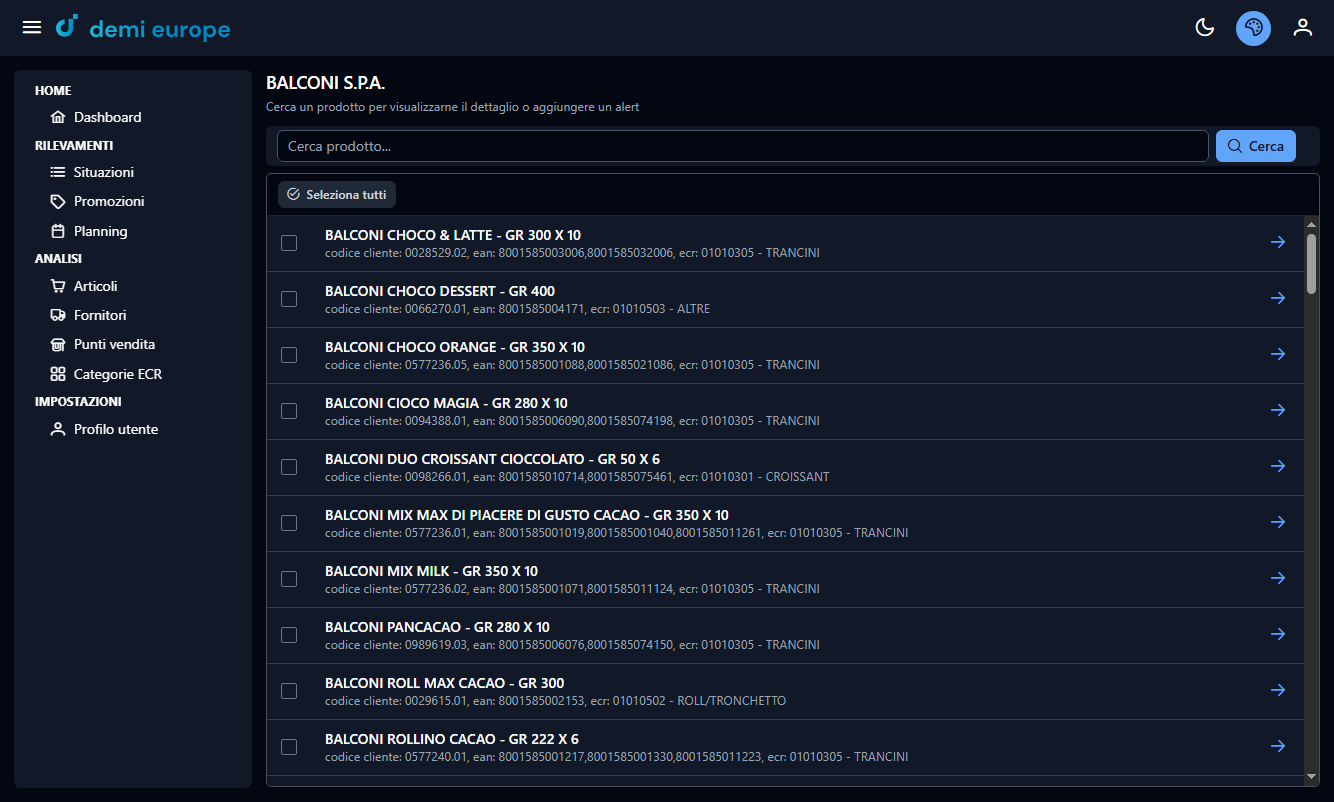
Suppliers: product catalogue by supplier with full-text search, useful for quickly identifying all items from a brand across surveys
https://rilevamenti.demieurope.com
ECR Categories: 5-level hierarchy with checkbox controls
https://rilevamenti.demieurope.com
Suppliers: product catalogue per brand with full-text search
Technologies Used
Development
The project began with an in-depth analysis of end-user workflows, with the goal of reducing the number of clicks needed to reach critical information. The Angular architecture was structured with lazy-loaded feature modules to keep initial bundles small despite the application's size.
Methodology
Continuous iterations: frequent releases agreed with the client, with immediate feedback and rapid adjustments to emerging requirements
API-first: ASP.NET Core Minimal API backend developed in parallel with Scalar documentation, enabling independent frontend development with mocks
Performance focus:AG Grid with virtual scrolling for dense grids, server-side Gzip compression, route lazy loading and SQL query optimisation
Security: JWT authentication with refresh tokens, rate limiting on the login endpoint, CORS restricted to authorised domains
How can I help you?
Write to me and let me know what you need, I'll be happy to help.